University of California, Irvine
EECS 170c
This study source was downloaded by 100000874968972 from CourseHero.com on 04-14-2024 12:41:21 GMT -05:00 https://www.coursehero.com/file/73491246/simulation1docx/ Part c) When Id was equal to 500µA, Vgs is found to be 2.84V. By running the HSpice DC operating point analysis for Vgs=2.84V and looking into the .lis file, gm is found
...[Show More]
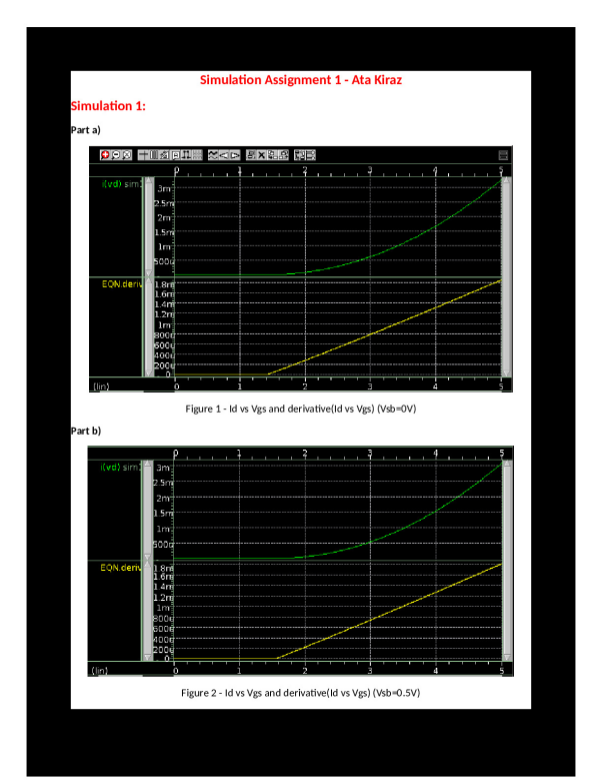
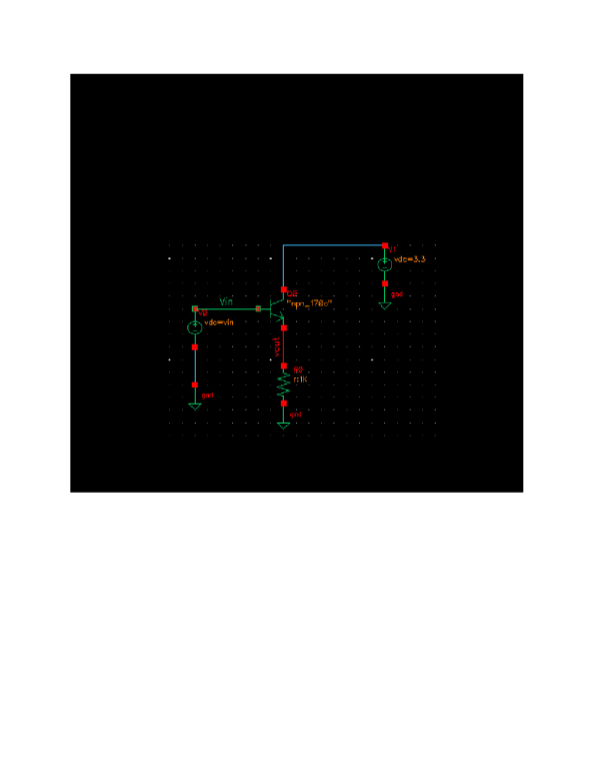
This study source was downloaded by 100000874968972 from CourseHero.com on 04-14-2024 12:41:21 GMT -05:00 https://www.coursehero.com/file/73491246/simulation1docx/ Part c) When Id was equal to 500µA, Vgs is found to be 2.84V. By running the HSpice DC operating point analysis for Vgs=2.84V and looking into the .lis file, gm is found to be 706.5757µA/V. Analysis – Simulation 1 As it is seen from the figures 1 and 2, when there is a positive voltage difference between the source and the body of a transistor, the threshold voltage increases. This is called the Body Effect. Since Vgs need to be greater than Vt for transistor to turn on, when the threshold voltage of a transistor increases, the required Vgs for the transistor to turn on increases as well. This can also be seen from figures 1 and 2 since the transistor in figure 2 turns on at around Vgs=1.6V compared to the transistor in figure 1 which turns on at around Vgs=1.4V. Simulation 2: Part a) Figure 3 – Id vs Vds (Vgs=5V(Blue), Vgs=2.5V(yellow), Vgs=0V(green)) This study source was downloaded by 100000874968972 from CourseHero.com on 04-14-2024 12:41:21 GMT -05:00 https://www.coursehero.com/file/73491246/simulation1docx/ Part b) Figure 4 – the same Id vs Vgs graph as figure 3 with the derivatives added and a zoomed in portion to find the slopes easier. Analysis – Simulation 2 From the Hspice DC Operating Point Listing (.lis file) the below values for gds were obtained; Vgs=0 → gds=0 Vgs=2.5 → gds=1.149µA/V Vgs=5 → gds=15.5489µA/V From the graph at figure 4, we looked at the slopes at Vds=3.5V which is a point where everything is in saturation. For Vgs=0 Curve, we got slope=2.01p and y=0.4n For Vgs=2.5 curve, we got slope=1.15µ and y=223.05µ For Vgs=5 curve, we got slope=15.5µ and y=3.057m
[Show Less]
-preview.png)