MGT6203 Data Analytics in BusinessGrade Homework#2 Part 2Instructions for Q1For parts A and B:PlantGrowth is a dataset in R that contains crop weights of a control group and two treatment groups.Clear the environment and get data> rm(list = ls())> set.seed(1)> library(datasets)>> data(PlantGrowth)> force(PlantGrowth)Perform the following operations:(i) Create two separate datasets, one with datapo
...[Show More]
MGT6203 Data Analytics in Business
Grade Homework#2 Part 2
Instructions for Q1
For parts A and B:
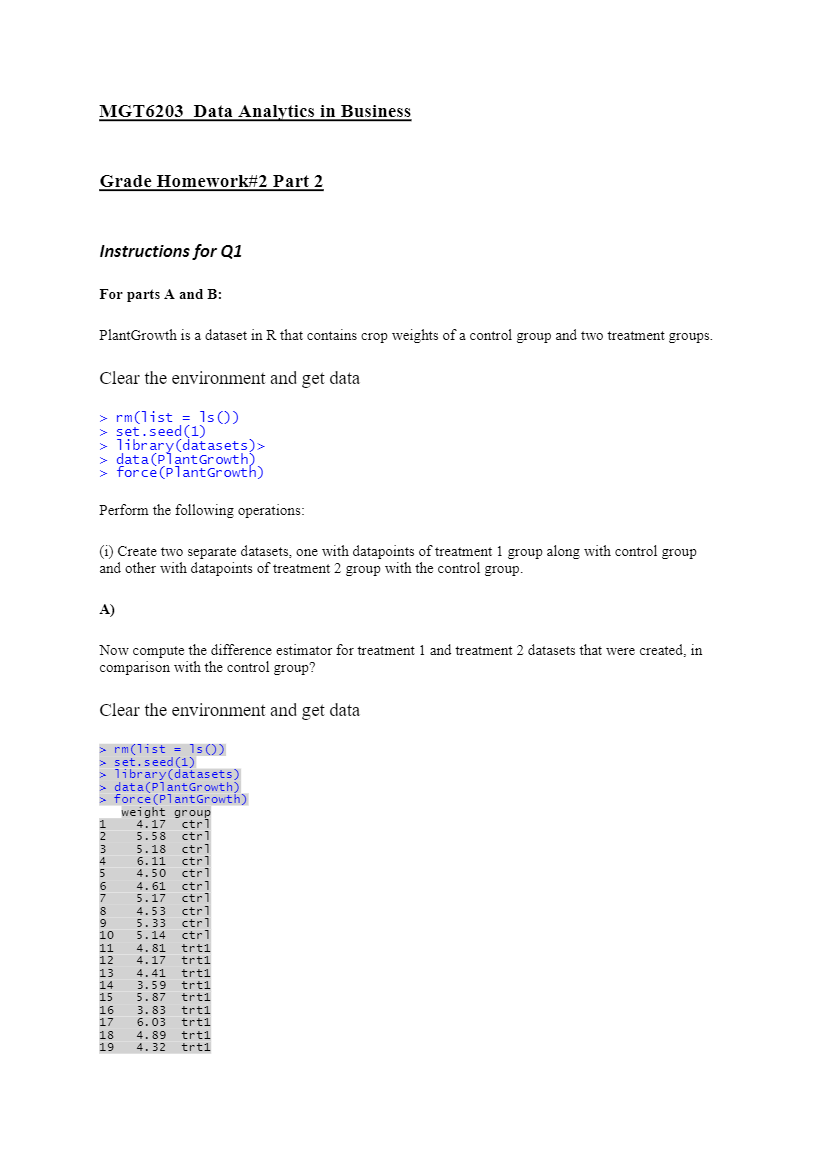
PlantGrowth is a dataset in R that contains crop weights of a control group and two treatment groups.
Clear the environment and get data
> rm(list = ls())
> set.seed(1)
> library(datasets)>
> data(PlantGrowth)
> force(PlantGrowth)
Perform the following operations:
(i) Create two separate datasets, one with datapoints of treatment 1 group along with control group
and other with datapoints of treatment 2 group with the control group.
A)
Now compute the difference estimator for treatment 1 and treatment 2 datasets that were created, in
comparison with the control group?
Clear the environment and get data
> rm(list = ls())
> set.seed(1)
> library(datasets)
> data(PlantGrowth)
> force(PlantGrowth)
weight group
1 4.17 ctrl
2 5.58 ctrl
3 5.18 ctrl
4 6.11 ctrl
5 4.50 ctrl
6 4.61 ctrl
7 5.17 ctrl
8 4.53 ctrl
9 5.33 ctrl
10 5.14 ctrl
11 4.81 trt1
12 4.17 trt1
13 4.41 trt1
14 3.59 trt1
15 5.87 trt1
16 3.83 trt1
17 6.03 trt1
18 4.89 trt1
19 4.32 trt1
20 4.69 trt1
21 6.31 trt2
22 5.12 trt2
23 5.54 trt2
24 5.50 trt2
25 5.37 trt2
26 5.29 trt2
27 4.92 trt2
28 6.15 trt2
29 5.80 trt2
30 5.26 trt2
Now create du
[Show Less]


-preview.jpeg)
-preview.jpeg)


-preview.jpeg)