Chapter 6
Human Capital
Note: Special icons in the margin identify problems requiring a computer or calculator .
n Solutions to Problems
1. Assuming the presence and prevalence of malaria within a given country, the invention of an
effective vaccine would shift upward the h(y) curve. The implication is that for any given level of
income per capita, the vaccine will increase the health
...[Show More]
Chapter 6
Human Capital
Note: Special icons in the margin identify problems requiring a computer or calculator .
n Solutions to Problems
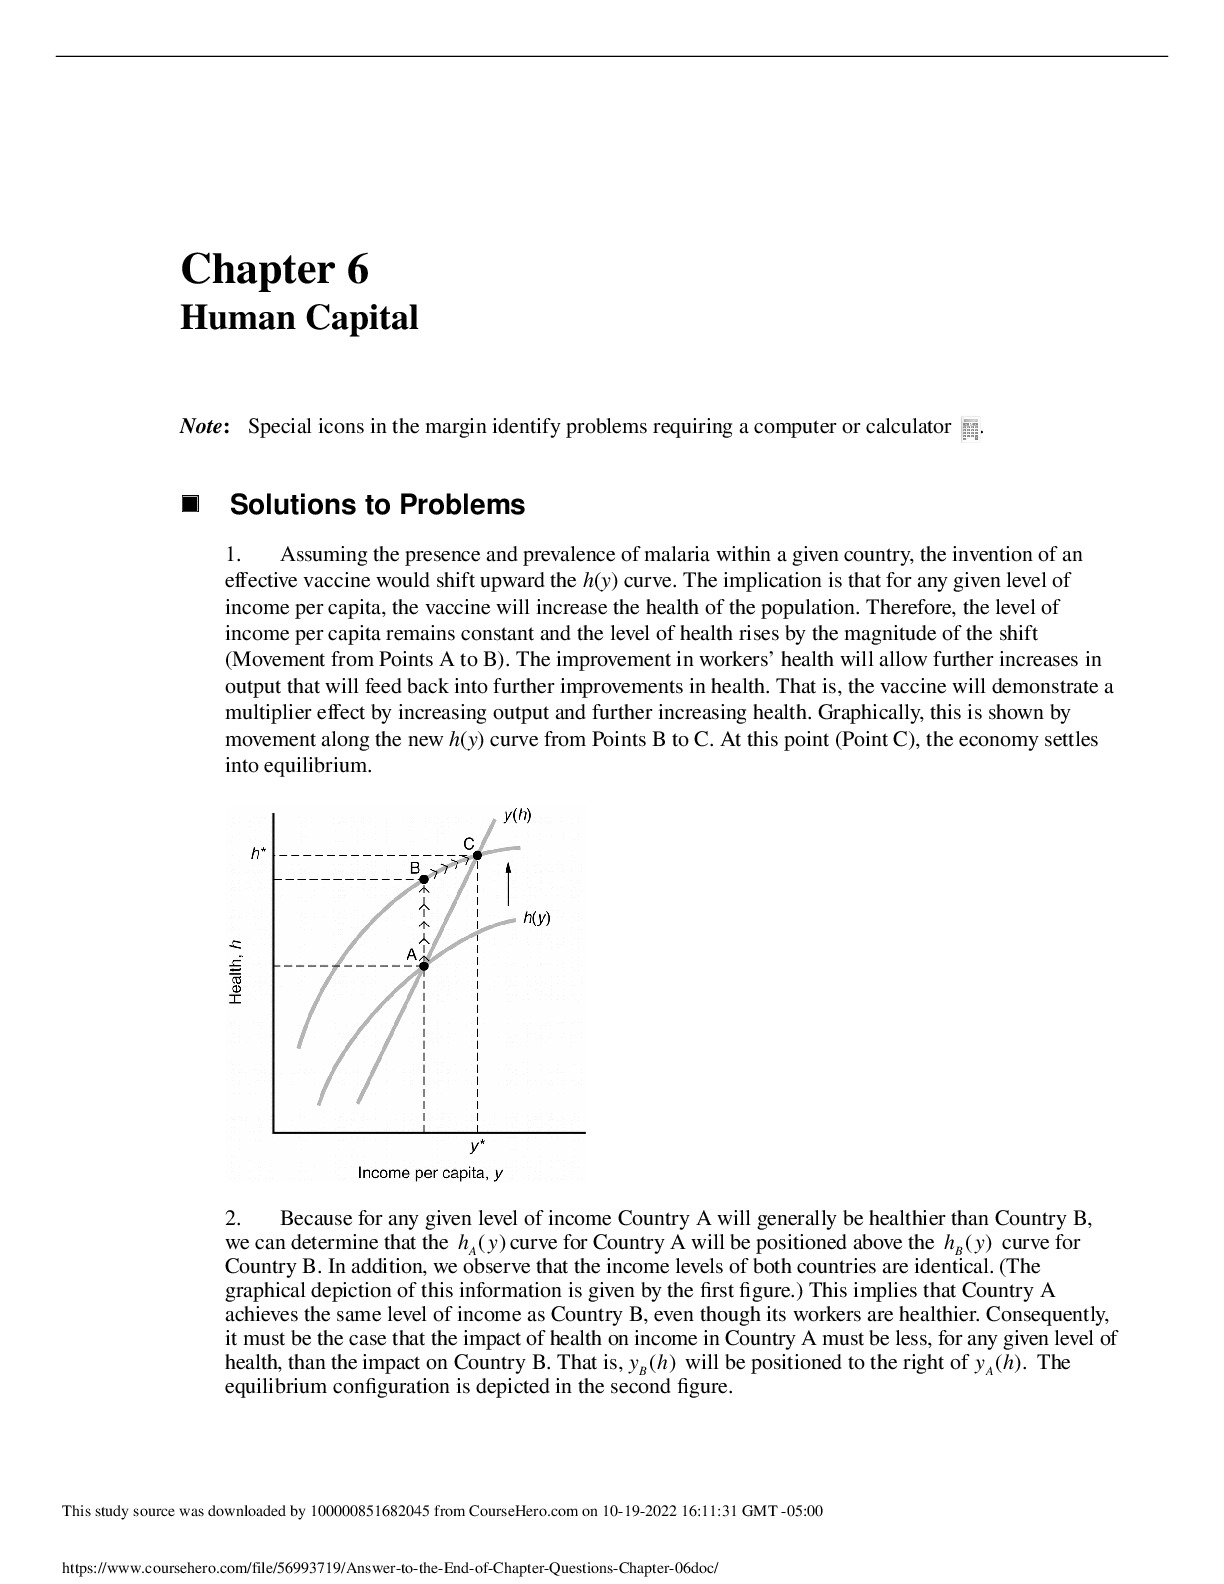
1. Assuming the presence and prevalence of malaria within a given country, the invention of an
effective vaccine would shift upward the h(y) curve. The implication is that for any given level of
income per capita, the vaccine will increase the health of the population. Therefore, the level of
income per capita remains constant and the level of health rises by the magnitude of the shift
(Movement from Points A to B). The improvement in workers’ health will allow further increases in
output that will feed back into further improvements in health. That is, the vaccine will demonstrate a
multiplier effect by increasing output and further increasing health. Graphically, this is shown by
movement along the new h(y) curve from Points B to C. At this point (Point C), the economy settles
into equilibrium.
2. Because for any given level of income Country A will generally be healthier than Country B,
we can determine that the h y A( ) curve for Country A will be positioned above the h y B( ) curve for
Country B. In addition, we observe that the income levels of both countries are identical. (The
graphical depiction of this information is given by the first figure.) This implies that Country A
achieves the same level of income as Country B, even though its workers are healthier. Consequently,
it must be the case that the impact of health on income in Country A must be less, for any given level of
health, than the impact on Country B. That is, y h B( ) will be positioned to the right of y h A( ). The
equilibrium configuration is depicted in the second figure.
[Show Less]