Goals: - Determine the percent of declared disasters that are floods.- Use web resources to determine whether there is a current danger of flooding or extreme precipitation in a region of the U.S.- Determine flood danger and recurrence interval Part I. Flood Disaster Frequency 1) What percent of all Federal Emergencies do you think are floods (ju
...[Show More]
Goals: - Determine the percent of declared disasters that are floods.
- Use web resources to determine whether there is a current danger of flooding or extreme precipitation in a region of the U.S.
- Determine flood danger and recurrence interval
Part I. Flood Disaster Frequency
1) What percent of all Federal Emergencies do you think are floods (just make a guess)?
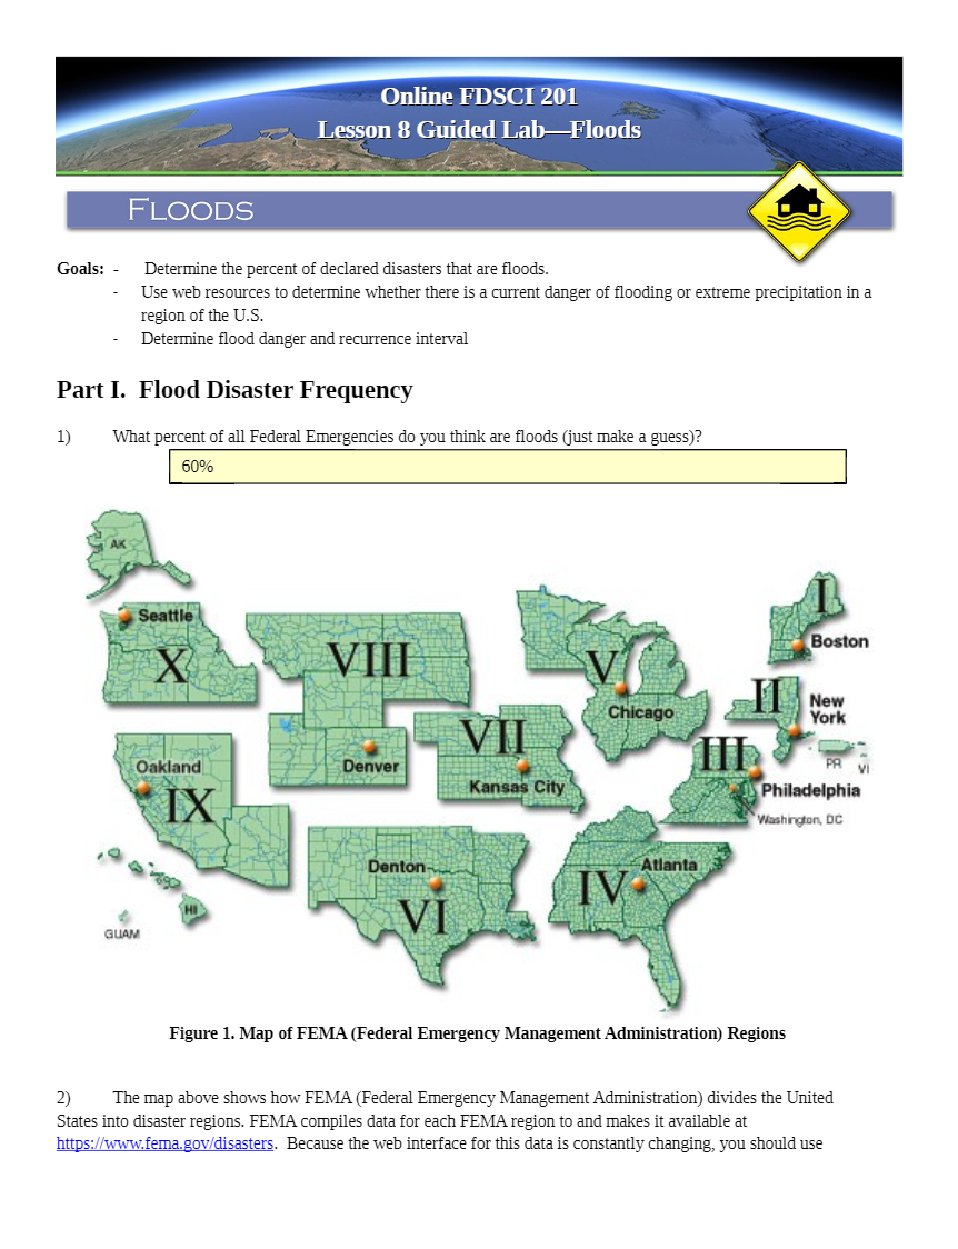
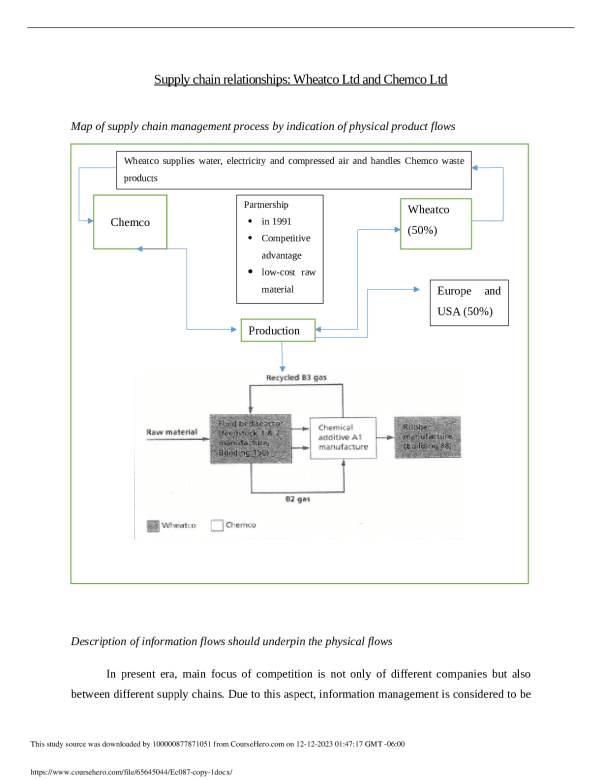
Figure 1. Map of FEMA (Federal Emergency Management Administration) Regions
2) The map above shows how FEMA (Federal Emergency Management Administration) divides the United States into disaster regions. FEMA compiles data for each FEMA region to and makes it available at
https://www.fema.gov/disasters. Because the web interface for this data is constantly changing, you should use the PDF summary entitled “FEMA Disaster Declarations 2000 2011 that is provided for you in I-Learn Record your data in the table below.
Number of Declared Federal Disaster Events for FEMA Disaster Management Regions
| Region | Number of Declared Federal Disaster Events of ANY Type | The number of FLOOD disaster Events | Percent of the disasters that were floods.
| I | 65 | 4 Floods | 6.2%
| II | 58 | 1 Flood | 1.7%
| III | 72 | 4 Floods | 5.6%
| IV | 133 | 1 Flood | 0.8%
| V | 78 | 7 Floods | 9.0%
| VI | 94 | 5 Floods | 5.3%
| VII | 90 | 7 Floods | 7.8%
| VIII | 57 | 10 Floods | 17.5%
| IX | 52 | 2 Floods | 3.8%
| X | 41 | 8 Floods | 19.5%
| TOTAL | 740 | 49 | 6.6%
3) How do the actual percentages of flood disasters compare with your guess?
[Show Less]