University of California, Irvine
EECS 170c
Angela Park (ID #33727152) EECS 170LC Spring 2020 Lab 1A (17240) EECS 170LC Lab Assignment Simulation #1 Calculations Simulation 1: Part A) The Vout halfway point of the saturation region is = 3.207 V. This value approximately 2 1.415 V +5 V corresponds to a Vin value of 1.58 V, which is the center of the saturation operating point (
...[Show More]
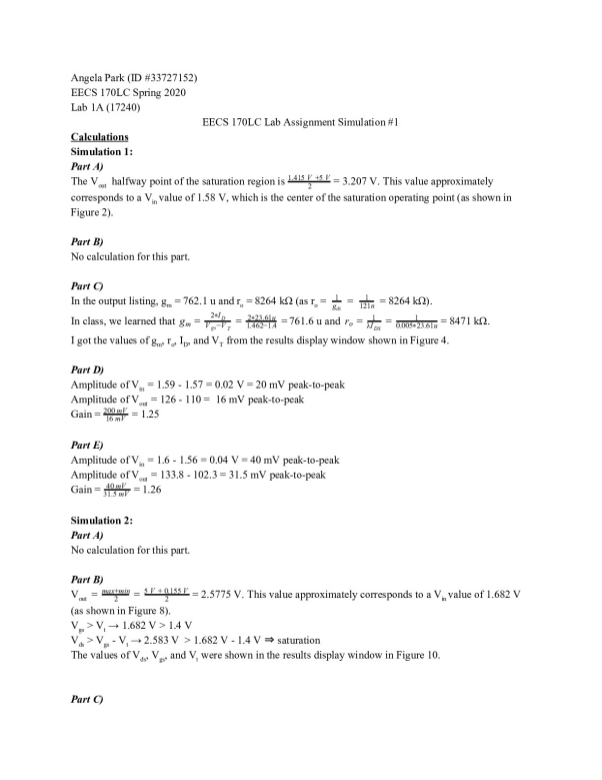
Angela Park (ID #33727152) EECS 170LC Spring 2020 Lab 1A (17240) EECS 170LC Lab Assignment Simulation #1 Calculations Simulation 1: Part A) The Vout halfway point of the saturation region is = 3.207 V. This value approximately 2 1.415 V +5 V corresponds to a Vin value of 1.58 V, which is the center of the saturation operating point (as shown in Figure 2). Part B) No calculation for this part. Part C) In the output listing, gm = 762.1 u and r o = 8264 kΩ (as r o = = = 8264 kΩ). 1 gds 1 121n In class, we learned that gm = 761.6 u and = 8471 kΩ. 2*ID V gs−V T = 2*23.61u 1.462−1.4 = ro = 1 λIDS = 1 0.005*23.61u I got the values of gm , r o , ID , and VT from the results display window shown in Figure 4. Part D) Amplitude of Vin = 1.59 - 1.57 = 0.02 V = 20 mV peak-to-peak Amplitude of Vout = 126 - 110 = 16 mV peak-to-peak Gain = = 1.25 16 mV 200 mV Part E) Amplitude of Vin = 1.6 - 1.56 = 0.04 V = 40 mV peak-to-peak Amplitude of Vout = 133.8 - 102.3 = 31.5 mV peak-to-peak Gain = = 1.26 40 mV 31.5 mV Simulation 2: Part A) No calculation for this part. Part B) Vout = 2.5775 V. This value approximately corresponds to a Vin = 2 value of 1.682 V max+min = 2 5 V + 0.155 V (as shown in Figure 8). Vgs > Vt → 1.682 V > 1.4 V Vds > Vgs - Vt → 2.583 V > 1.682 V - 1.4 V ⇒ saturation The values of Vds , Vgs , and Vt were shown in the results display window in Figure 10. Part C) In the output listing, gm = 3.428 m and r o = 408 kΩ (as r o = = = 408 kΩ). 1 gds 1 2.449u In class, we learned that gm = 3.453 m and = 414 kΩ. ID V T = 1.4 483.4u = ro = 1 λIDS = 1 0.005*483.4uu I got the values of gm , r o , ID , and VT from the results display window shown in Figure 10. Part D) A = gm * (RD || r o )= 3.428 m * (5 kΩ || 408 kΩ) = 3.428 m * 4.939 kΩ = 16.93 Slope of graph = | | | 2.338| 2.338 1.428−1.806 4.9759−0.3121 = − 1 = 1 Part E) Amplitude of Vin = 1.683 - 1.681 = 2 mV peak-to-peak Amplitude of Vout = 2.566 - 2.599 = 33 mV peak-to-peak Gain = = 16.5 2 mV 33 mV Part F) Amplitude of Vin = 1.693 - 1.671 = 22 mV peak-to-peak Amplitude of Vout = 2.393 - 2.764 = 371 mV peak-to-peak Gain = = 16.8 22 mV 371 mV Simulation 3: Part A) Amplitude of vx = 117 mV - 119 mV = 2 mV peak-to-peak Amplitude of ix = 2 uV peak-to-peak r out = amplitude of i 1 kΩ x amplitude of vx = 2 uV 2 mV = Part B) Amplitude of vx = 2.578 V - 2.588
[Show Less]
-preview.png)

-preview.png)