EVR 1001Lab 4 Instructors ManualLab 4 Biomagnification Through a Food Chain Description of the Lab In this laboratory exercise, students will use printed M&M candies to represent the presence of DDT in a food chain. Outline of Investigation Students will work in pairs or individually. Each pair of students starts with 100 M&M candies. Each candy represents a phytoplank
...[Show More]
EVR 1001
Lab 4 Instructors Manual
Lab 4
Biomagnification Through a Food Chain
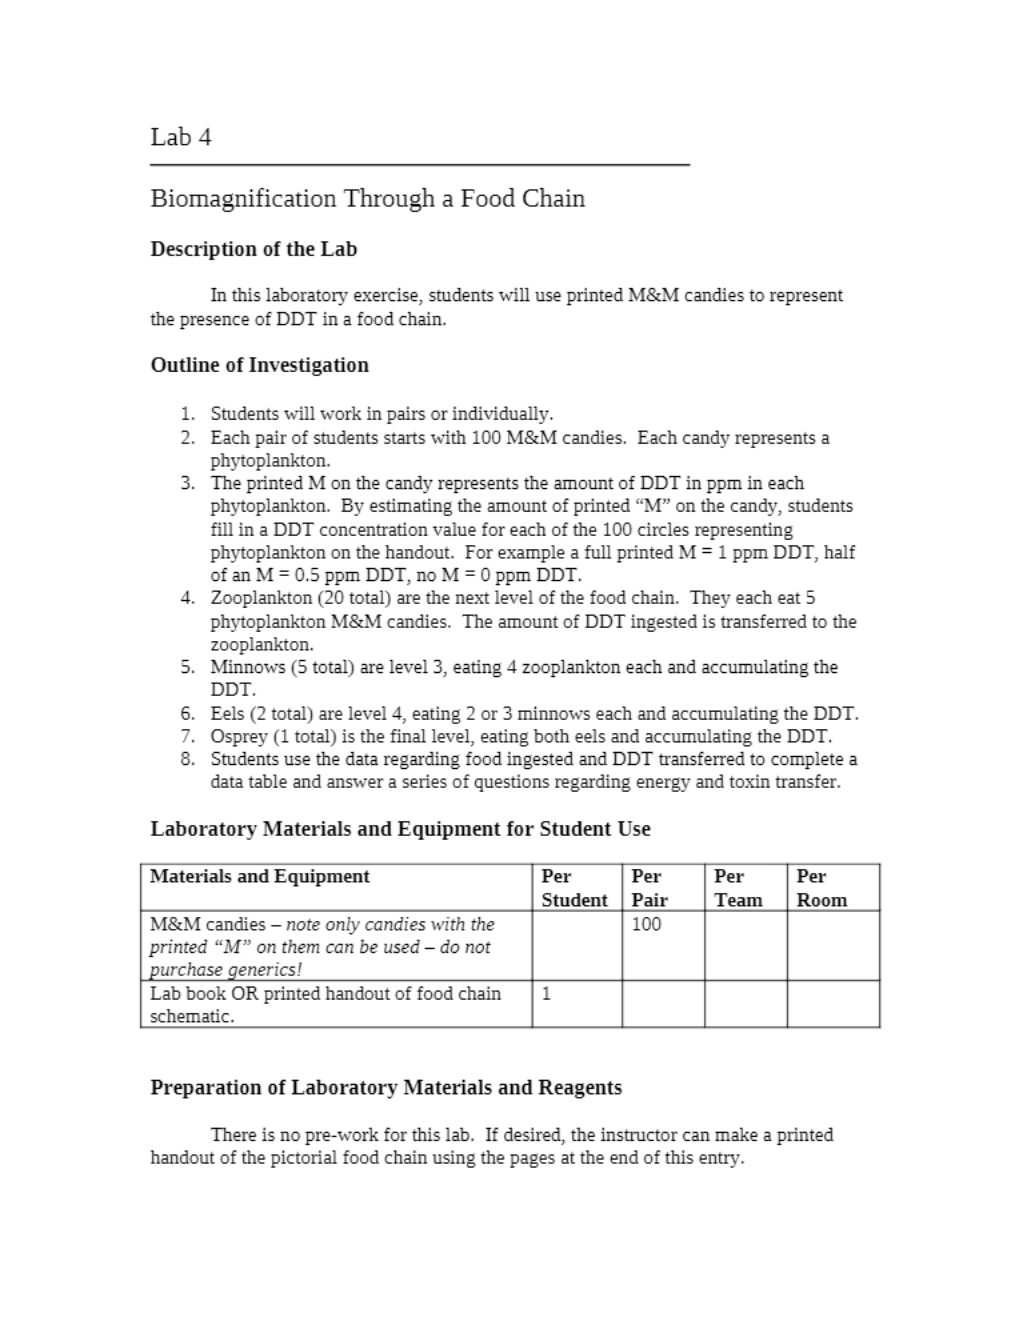
Description of the Lab
In this laboratory exercise, students will use printed M&M candies to represent the presence of DDT in a food chain.
Outline of Investigation
- Students will work in pairs or individually.
- Each pair of students starts with 100 M&M candies. Each candy represents a phytoplankton.
- The printed M on the candy represents the amount of DDT in ppm in each phytoplankton. By estimating the amount of printed “M” on the candy, students fill in a DDT concentration value for each of the 100 circles representing phytoplankton on the handout. For example a full printed M = 1 ppm DDT, half of an M = 0.5 ppm DDT, no M = 0 ppm DDT.
- Zooplankton (20 total) are the next level of the food chain. They each eat 5 phytoplankton M&M candies. The amount of DDT ingested is transferred to the zooplankton.
- Minnows (5 total) are level 3, eating 4 zooplankton each and accumulating the DDT.
- Eels (2 total) are level 4, eating 2 or 3 minnows each and accumulating the DDT.
- Osprey (1 total) is the final level, eating both eels and accumulating the DDT.
- Students use the data regarding food ingested and DDT transferred to complete a data table and answer a series of questions regarding energy and toxin transfer.
Laboratory Materials and Equipment for Student Use
[Show Less]
-preview.png)


-preview.png)