lab04.University of California, Berkeley DATA MISC
lab04
September 16, 2018
1 Lab 4: Functions and Visualizations
Welcome to Lab 4! This week, we’ll learn about functions, table methods such as apply, and how
to generate visualizations!
Recommended Reading:
• Applying a Function to a Column
• Visualizations
First, set up the notebook by running the cell below.
In [1]: import nump
...[Show More]
lab04.University of California, Berkeley DATA MISC
lab04
September 16, 2018
1 Lab 4: Functions and Visualizations
Welcome to Lab 4! This week, we’ll learn about functions, table methods such as apply, and how
to generate visualizations!
Recommended Reading:
• Applying a Function to a Column
• Visualizations
First, set up the notebook by running the cell below.
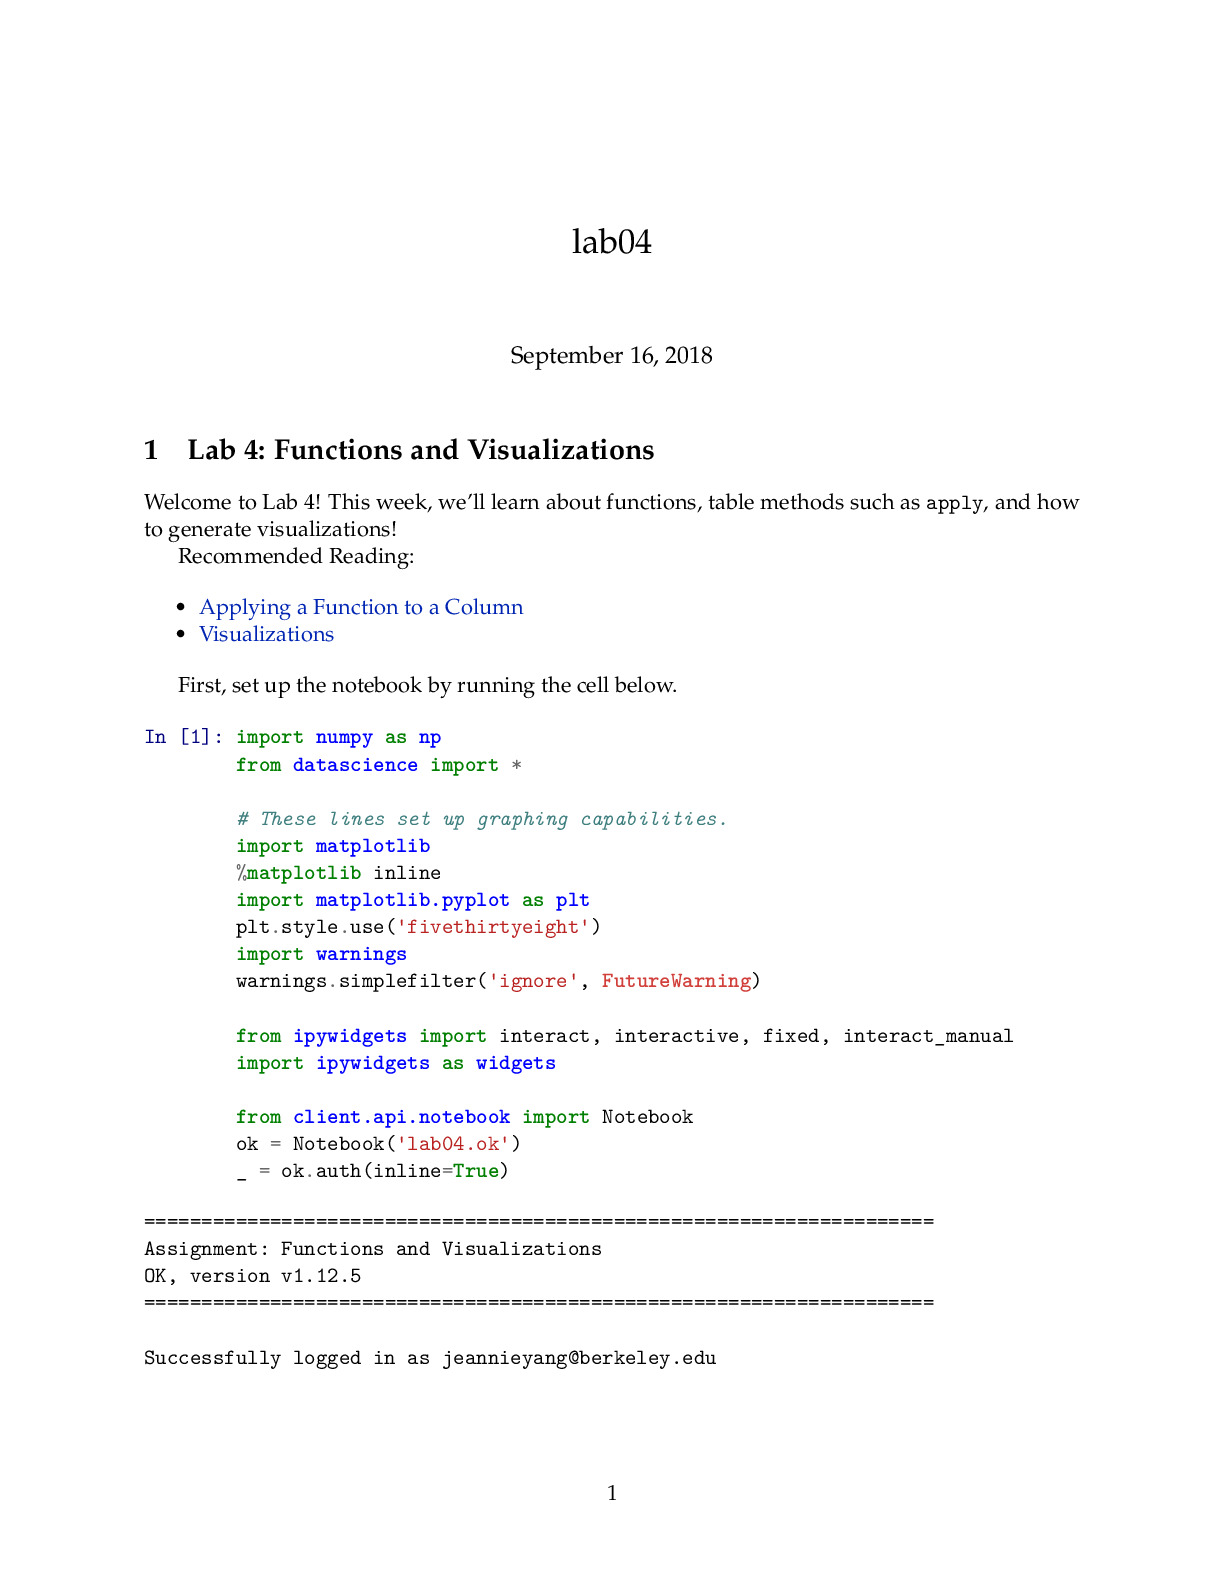
In [1]: import numpy as np
from datascience import *
# These lines set up graphing capabilities.
import matplotlib
%matplotlib inline
import matplotlib.pyplot as plt
plt.style.use('fivethirtyeight')
import warnings
warnings.simplefilter('ignore', FutureWarning)
from ipywidgets import interact, interactive, fixed, interact_manual
import ipywidgets as widgets
from client.api.notebook import Notebook
ok = Notebook('lab04.ok')
_ = ok.auth(inline=True)
=====================================================================
Assignment: Functions and Visualizations
OK, version v1.12.5
=====================================================================
Successfully logged in as [email protected]
1
[Show Less]


-preview.png)