The Mathematical Association of Victoria
Trial Examination 2020
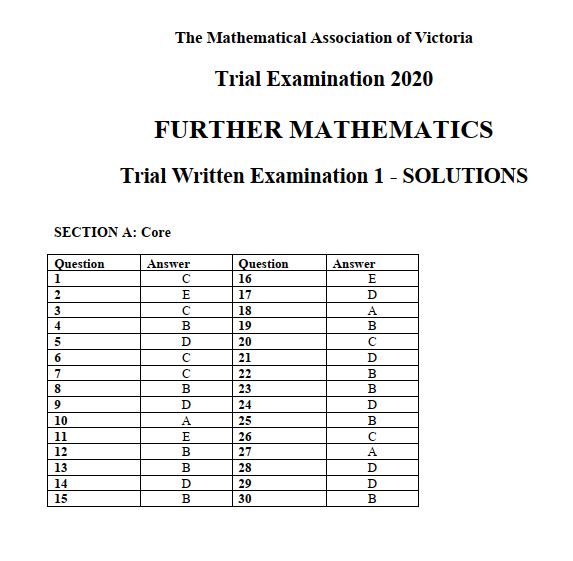
FURTHER MATHEMATICS Trial Written Examination 1 - SOLUTIONS 2020 MAV Further Mathematics Trial Exam 1, Solutions 3
CLICK HERE TO GET Examination 2020 FURTHER MATHEMATICS Written Examination 1
Data Analysis
Question 1 Answer C
The data is clearly clustered towards the upper end of the data with a tail at the lower end. This is
indicative of a negative skew.
Question 2 Answer E
There are 99 values in the data. This means that the 50th value, 8, is the median with 49 values in each
of the upper and lower halves. The 25th value in the lower half, 6, is
Q1 and the 25th value in the
upper half, 10, is
Q3 . The minimum rating was 1 and the maximum rating was 10.
The modal value is the most common value, 10. The mean has not been calculated, but because the
data is skewed the mean is usually drawn towards the tail of the distribution, so the mean will be less
than the median.
From this information it can be seen that
Q3 and the maximum have the same value of 10.
Question 3 Answer C
The data where a rating of 1 = “Terrible” and a rating of 10 = “Delicious” is an example of ordinal
categorical data. The numbers used are allocated values given to verbal descriptions rather than
measured or counted values. Because the rating has a built in order from “Terrible” to “Delicious” it
is ordinal.
Question 4 Answer B
There are 20 countries in the survey. On a log10 scale, 0 represents 1, 1 represents 10, 2 represents 100
and 3 represents 1000, so when looking for the sales above $1000 million on this scale, the values
above 3 are required. There are three values between 3 and 4 on the scale, so the percentage above
$1000 million is 3 100 15%
20
× = .
Question 5 Answer D
The interquartile range is Q3 – Q1. From the boxplot it can be seen that Q1 = 70 and Q3 = 120 so the
interquartile range is 120 – 70 = 50.
2020 MAV Further Mathematics Trial Exam 1, Solutions 4
© The Mathematical Association of Victoria, 2020
Question 6 Answer C
Each of the options is explored below:
Option A: Generally, more meat burgers were sold than plant-based burgers is true as the boxplot for
meat burgers is centred higher with a median of approximately 165 compared to a median of 90 for
plant-based burgers.
Option B: The distribution of meat burgers was negatively skewed is true, because the top 50% of the
data is clustered with the lower 50% more spread out.
Option C: 100% of the meat burger sales were in the top 25% of the plant-based burger sales is false.
In fact 100% of the meat burger sales above the 75th percentile, but not in the top 25% of the plantbased burger sales.
Option D: 75% of the meat burger sales were more than any of the plant-burger sales is true because
all of the boxplot for meat is above
Q3 for the plant-based burgers.
Option E: 75% of the plant-based sales were less than the meat burger sales is true as the Q3 value for
plant-based sales is 120 which is the same as the minimum value for meat burger sales.
Question 7 Answer C
The packets have a mean weight of 500 g with a standard deviation of 7 g. The distribution of weights
can be seen on the graphic below:
It can be seen that there are 34% between 500 g and 507 g and also 13.5% between 507 g and
514 g. This means that there is a total 47.5% between 500 g and 514 g.
2020 MAV Further Mathematics Trial Exam 1, Solutions 5
© The Mathematical Association of Victoria, 2020
Question 8 Answer B
The number of nails packed in the boxes is normally distributed and 30 100 0.15%
20000
× = nails are
rejected at each end of the distribution.
Using the 68 – 95 – 99.7% rule, this places the two values at
x S ± × 3
x .
Because of this there are 6 standard deviations between 332 and 368, so 368 332 6
Sx = = -6 .
Also, the mean must be half way between these two values so 368 332 350
2
x
+
= = .
Using this information, the following values can be added to the 68 – 95 – 99.7% graphic:
Now each option can be verified:
Option A: True 16 20000 3200
100
× = boxes of nails will have more than 356 nails
Option B: False 16 20000 3200
100
× = boxes of nails (not 500) will have fewer than 344 nails
Option C: True 68 20000 13600
100
× = boxes of nails will have between 344 and 356 nails
Option D: True 81.5 20000 16300
100
× = boxes of nails will have between 344 and 362 nails
Option E: True 2.35 20000 470
100
× = boxes of nails will have between 362 and 368 nails
Question 9 Answer D
The two standard scores can be calculated as shown:
3130 2177
1.3371...
zhigh 264
-
= = and 2386 2177 1.4810...
zlow 264
-
= = -
The difference between these two values is 1.3371 1.4810 2.8181... - - =
This is closest to 2.82, answer D


-by-Gary-Donell-SOLUTIONS-MANUAL-preview.jpeg)
-by-Gary-Donell-INSTRUCTOR’S-SOLUTIONS-MANUAL-preview.jpeg)