Western University
GEOG 2010A
Introduction: Detailed climate data has been collected at hundreds of stations in Canada for over 100 years. From this information, climates have been classified and maps and graphs have been produced to provide a visual perspective of the many climates of the country. Objective: The objective of this part of the assignment is to develop a better
...[Show More]
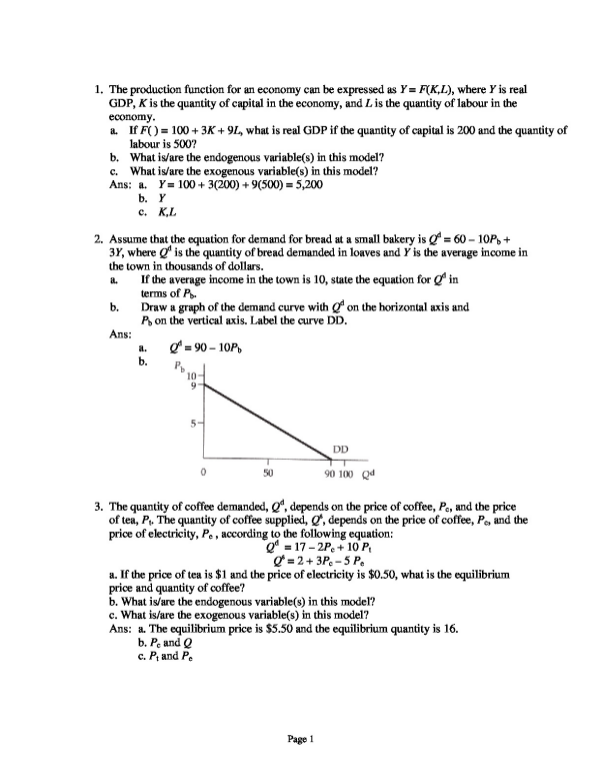
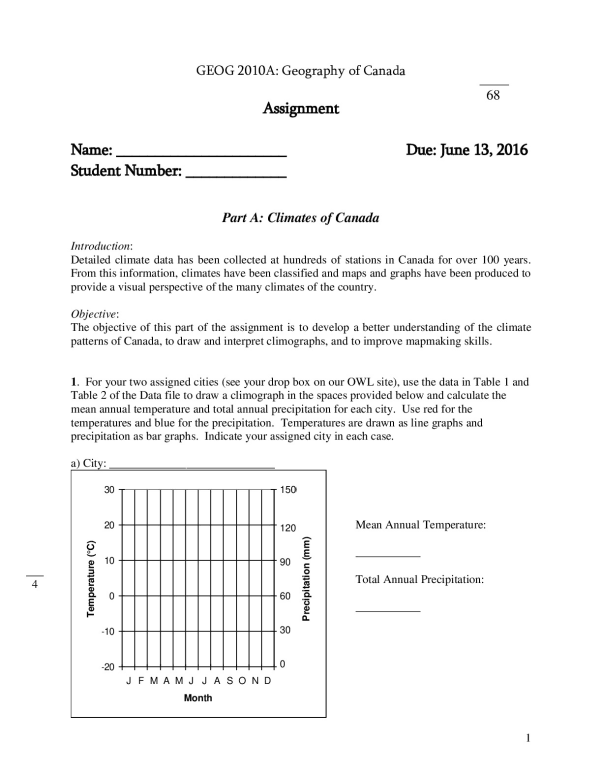
Introduction: Detailed climate data has been collected at hundreds of stations in Canada for over 100 years. From this information, climates have been classified and maps and graphs have been produced to provide a visual perspective of the many climates of the country. Objective: The objective of this part of the assignment is to develop a better understanding of the climate patterns of Canada, to draw and interpret climographs, and to improve mapmaking skills. 1. For your two assigned cities (see your drop box on our OWL site), use the data in Table 1 and Table 2 of the Data file to draw a climograph in the spaces provided below and calculate the mean annual temperature and total annual precipitation for each city. Use red for the temperatures and blue for the precipitation. Temperatures are drawn as line graphs and precipitation as bar graphs. Indicate your assigned city in each case.
[Show Less]

-preview.png)