University of California, Los Angeles LIFESCIENC 30A LS 30A-1 Homework 4 Solutions.LS 30A Homework 4 Solution (64 points total, answers in bold) Daniel Sun
Section 1.4:
FE10
a) Which variable represents which population? Justify your answer. (2)
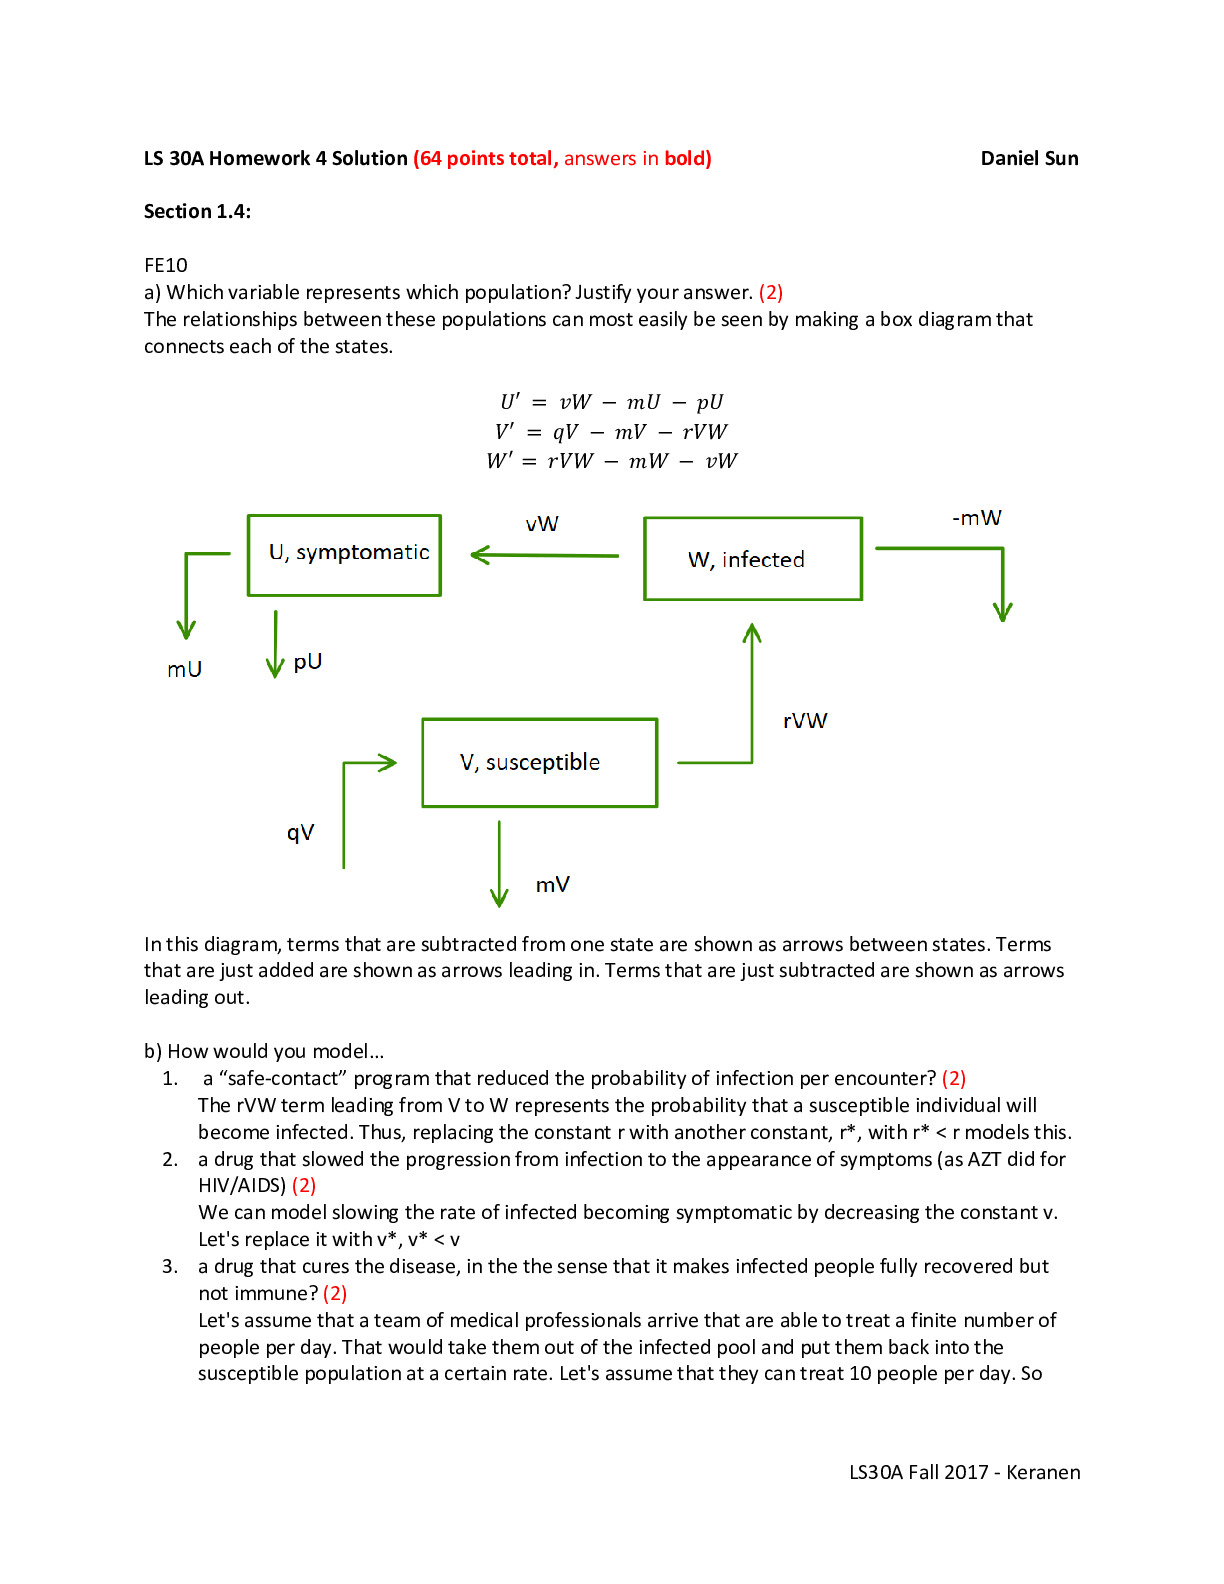
The relationships between these populations can most easily be seen by making a box diagram that
connects each of the states.
?′ = ?? - ?? - ??
...[Show More]
University of California, Los Angeles LIFESCIENC 30A LS 30A-1 Homework 4 Solutions.LS 30A Homework 4 Solution (64 points total, answers in bold) Daniel Sun
Section 1.4:
FE10
a) Which variable represents which population? Justify your answer. (2)
The relationships between these populations can most easily be seen by making a box diagram that
connects each of the states.
?′ = ?? - ?? - ??
?′ = ?? - ?? - ???
?′ = ??? - ?? - ??
In this diagram, terms that are subtracted from one state are shown as arrows between states. Terms
that are just added are shown as arrows leading in. Terms that are just subtracted are shown as arrows
leading out.
b) How would you model…
1. a “safe-contact” program that reduced the probability of infection per encounter? (2)
The rVW term leading from V to W represents the probability that a susceptible individual will
become infected. Thus, replacing the constant r with another constant, r*, with r* < r models this.
2. a drug that slowed the progression from infection to the appearance of symptoms (as AZT did for
HIV/AIDS) (2)
We can model slowing the rate of infected becoming symptomat
[Show Less]

-preview.png)

-preview.png)

-preview.png)