Nueva Ecija University of Science and Technology
ENGINEERIN 2013104129
TIME SCALED EVENT NETWORK The Gantt Chart The Gantt chart is a popular tool for planning and scheduling simple projects. It serves as an aid of the manager to schedule project activities and then, to monitor progress over time by comparing the planned progress to the actual work progress. Once completed, t
...[Show More]
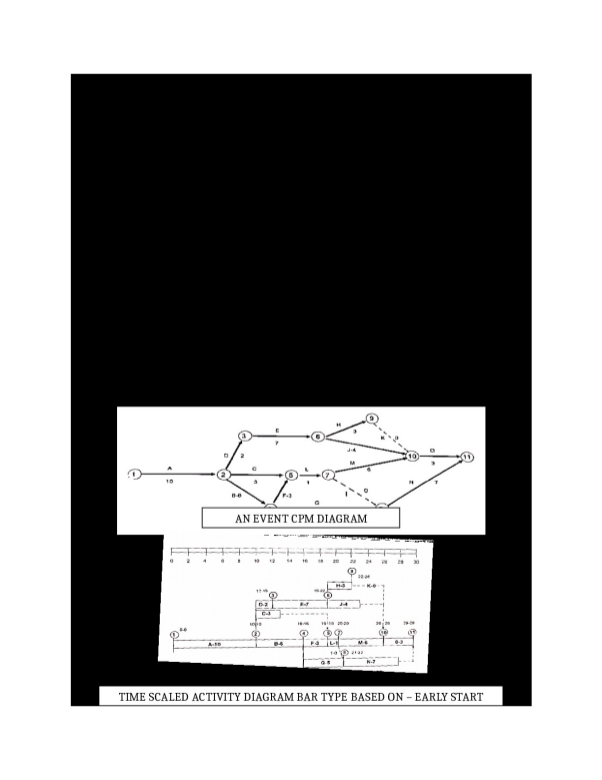
TIME SCALED EVENT NETWORK The Gantt Chart The Gantt chart is a popular tool for planning and scheduling simple projects. It serves as an aid of the manager to schedule project activities and then, to monitor progress over time by comparing the planned progress to the actual work progress. Once completed, the chart indicate which activities were to occur, their planned duration and when they will occur. Other information from the chart includes: 1. 2. The ongoing activities on any date can be seen from the diagram by using a straight edge or ruler vertically on the desired date intersecting the arrows representing the work activities. The arrows intersected by the straight edge or ruler, are the activities supposed to be ongoing on that date. By viewing the individual project program, the number of men, machines and materials supposed to be used on the project on such date can be determined. 3. The request for time extension of the project can be determined by looking at the diagram. If the delay is due to reasons beyond control of man such as rain, flood and typhoon and such delay is along the critical path, the request should be considered. But if the delay is along a lax path, the time extension request should not be granted if the delay incurred is less than the total float of the activity that has been delayed. AN EVENT CPM DIAGRAM TIME SCALED ACTIVITY DIAGRAM BAR TYPE BASED ON – EARLY START TIME SCALED ACTIVITY DIAGRAM BAR TYPE BASED ON – EARLY START TIME SCALED ACTIVITY DIAGRAM BAR TYPE BASED ON – LATE START TIME SCALED ACTIVITY DIAGRAM BAR TYPE BASED ON – EARLY START Manpower Leveling The consequence of employment fluctuation and equipment utilization adds to the cost of the project. This is a problem where the only solution is to keep employment at an acceptable level. TIME SCALED ACTIVITY DIAGRAM BAR TYPE BASED ON – LATE START TIME SCALED NETWORK AND MANPOWER LEVELING TIME SCALED CPM NETWORK, MANPOWER LOADING CHART The effective utilization of the Activity Float to level resource requirement is illustrated in the following hypothetical project. The activities are shown along the arrows with their respective manpower loading and the corresponding time estimate for each activity. The time scaled network has all the activities scheduled at their earliest possible start dates. From figure 7 – 7 and 7 – 8 the daily employment on the activities are tabulated as follows: 1. Days 1 to 4 the manpower of activities are: Activity A = 10 men for 11 days Activity B = 10 men for 4 days Activity C = 5 men for 7 days Activity E = 15 men for 5 days Total = 40 men x 4 days =160 man days B – 4 Days E – 5 Days C – 7 Days A – 11 Days 2. Day 5 for activities A, C, D, and E we have : A = 10 men C = 5 men D = 15 men
[Show Less]