Liberty University PSYCH 512 Factorial SPSS 3 Assignment Instructions 1 . - PSYC 515 SPSS M3 1 FACTORIAL DESIGN SPSS WORKSHEET INSTRUCTIONS OVERVIEW This worksheet is
OVERVIEW
This worksheet is designed to assess your ability to perform, interpret, report, and graphically present various
factorial designs. These are some of the most sophisticated analyses in our field and require practice
...[Show More]
Liberty University PSYCH 512 Factorial SPSS 3 Assignment Instructions 1 . - PSYC 515 SPSS M3 1 FACTORIAL DESIGN SPSS WORKSHEET INSTRUCTIONS OVERVIEW This worksheet is
OVERVIEW
This worksheet is designed to assess your ability to perform, interpret, report, and graphically present various
factorial designs. These are some of the most sophisticated analyses in our field and require practice and
thought to perform and interpret. These tests can yield conclusions that change the direction in one’s field.
Being able to critically evaluate such results is paramount to maintaining competency in one’s field, and being
able to produce such analyses in a competent manner is a coveted skill in our field.
INSTRUCTIONS
Be sure you have reviewed this module’s assigned readings and presentations before completing this
assignment. This assignment is worth 50 points. Each question is worth 3 content points except where otherwise
indicated (graphs are worth 4 points; results write-ups are 5 pts each- 45 content points total). Five (5) points are
assigned to general formatting. This includes using ensuring the homework is completed and submitted
according to the instructions, SPSS output and images are legible and relevant, and that basic college level
writing skills (e.g., grammar) are used in the write-ups. Answers should be placed where indicated (e.g.,
“ANSWER”). Note: all questions must be attempted to be eligible for full credit of “format” points.
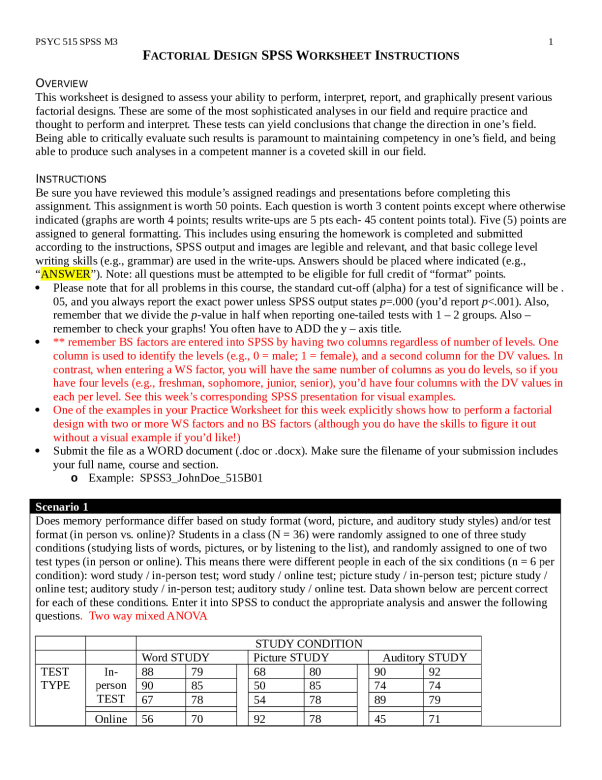
Please note that for all problems in this course, the standard cut-off (alpha) for a test of significance will be .
05, and you always report the exact power unless SPSS output states p=.000 (you’d report p<.001). Also,
remember that we divide the p-value in half when reporting one-tailed tests with 1 – 2 groups. Also –
remember to check your graphs! You often have to ADD the y – axis title.
** remember BS factors are entered into SPSS by having two columns regardless of number of levels. One
column is used to identify the levels (e.g., 0 = male; 1 = female), and a second column for the DV values. In
contrast, when entering a WS factor, you will have the same number of columns as you do levels, so if you
have four levels (e.g., freshman, sophomore, junior, senior), you’d have four columns with the DV values in
each per level. See this week’s corresponding SPSS presentation for visual examples.
One of the examples in your Practice Worksheet for this week explicitly shows how to perform a factorial
design with two or more WS factors and no BS factors (although you do have the skills to figure it out
without a visual example if you’d like!)
Submit the file as a WORD document (.doc or .docx). Make sure the filename of your submission includes
your full name, course and section.
o Example: SPSS3_JohnDoe_515B01
[Show Less]


-preview.png)
-preview.png)